
SODI TNL 2026 S2 R03 - Race
✨ AI Race Insights
The Rocket Racing Club delivered a strong performance at Daytona Milton Keynes, with several drivers showing marked improvements from their previous session, highlighted by Liam's outstanding pace.
Show full analysis
Track Map
Linkback & Cliff Drop layout with each driver's helmet running their best lap. Switch to GPS to animate using recorded pace instead of constant speed.
🛰️ Advanced GPS Telemetry Available
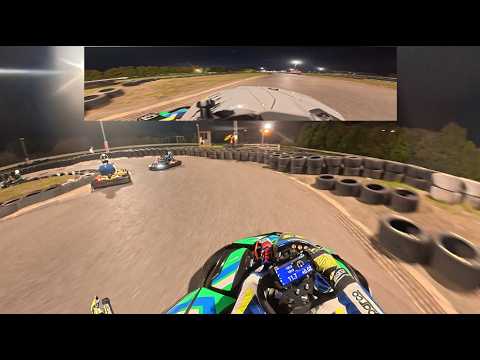
We have full GPS, speed, and sensor data for this race. View detailed driving lines, G-Force analysis, and calculated lap times.
View Full GPS Analysis & Telemetry →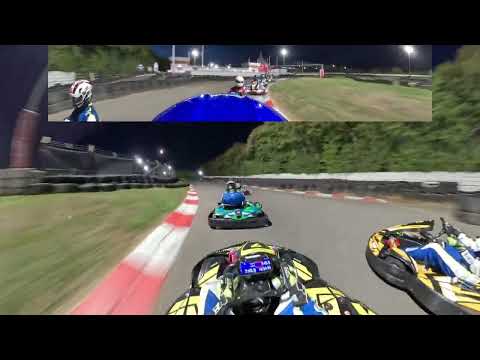

Performance Stats
Final classification with each driver's best lap, gap to first, and consistency. Top 25% Avg ★ filters out traffic and mistakes for a true pace reference.
| Position | Driver | Kart | Best Lap | Gap to 1st | Average Lap | Top 25% Avg ★ | Consistency (Std Dev) |
|---|---|---|---|---|---|---|---|
| 12 |  Liam Liam | #35+0.66% | +1.153s | 0.592s | |||
| 15 |  Chris Chris | #7+1.92% | +2.146s | 0.661s | |||
| 17 |  Dan Dan | #1+1.76% | +2.140s | 1.082s | |||
| 19 |  Shaun Shaun | #33+1.78% | +1.905s | 0.882s | |||
| 20 |  Harrison Harrison | #2+1.87% | +2.079s | 0.974s | |||
| — | Team Average | — | — | — | — | 0.838s |
Lap Time Comparison
Lap-by-lap times for all RRC members in this heat — spot when drivers found their rhythm or where time was lost.
Lap-by-Lap Comparison
Drivers ordered by final finishing position. Diff columns show the time difference between adjacent drivers.
| Lap |  Liam Liam | Diff |  Chris Chris | Diff |  Dan Dan | Diff |  Shaun Shaun | Diff |  Harrison Harrison |
|---|---|---|---|---|---|---|---|---|---|
| 1 | +1.435s | +1.440s | -0.878s | -0.331s | |||||
| 2 | +0.385s | -0.192s | +0.202s | +1.460s | |||||
| 3 | +1.629s | +0.572s | +0.250s | +1.067s | |||||
| 4 | +0.364s | -0.006s | +1.680s | -1.246s | |||||
| 5 | +1.510s | -0.095s | +0.859s | -0.321s | |||||
| 6 | +0.030s | -0.672s | +0.361s | +0.359s | |||||
| 7 | +0.996s | +0.390s | -0.203s | -0.084s | |||||
| 8 | +0.902s | +1.177s | -0.258s | -0.600s | |||||
| 9 | +0.939s | +1.418s | -0.284s | +0.384s | |||||
| 10 | +1.264s | -0.487s | +0.053s | +0.138s | |||||
| 11 | +1.157s | +0.543s | -0.412s | +1.812s | |||||
| 12 | +1.367s | -0.189s | -0.670s | +0.174s | |||||
| 13 | +0.885s | -0.487s | +0.750s | -0.587s | |||||
| 14 | +2.198s | -1.461s | -0.037s | -0.001s | |||||
| 15 | +0.560s | +0.001s | +0.082s | -0.008s | |||||
| 16 | +0.469s | — | — | — | — | — | — |
Gap Analysis
Each RRC driver's lap time vs the field's mean. Values below 0 mean the driver was faster than average.
Each RRC driver's lap times vs Liam. Values below 0 mean the driver was faster than Liam on that lap.
Each RRC driver vs the highest-finishing regular competitor in this heat. Values below 0 mean the driver was faster.
Position per Lap
On-track classification at the end of each lap, derived from the order drivers crossed start/finish. 1 is the leader; lines crossing each other are overtakes.